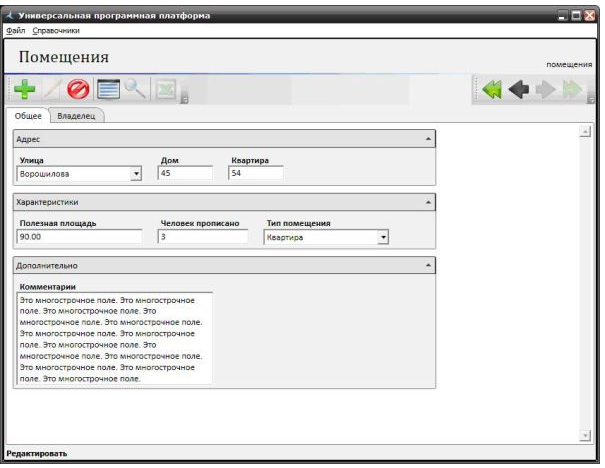
Automatically generated UI for CRUD opereations. UI was generated from Xml definitions
of database tables. Supported reference tables. There were some restrictions on
database: primary keys, foreign kes etc. Inspired by Evolutility.
1) Automatic UI generation. Picture 1.
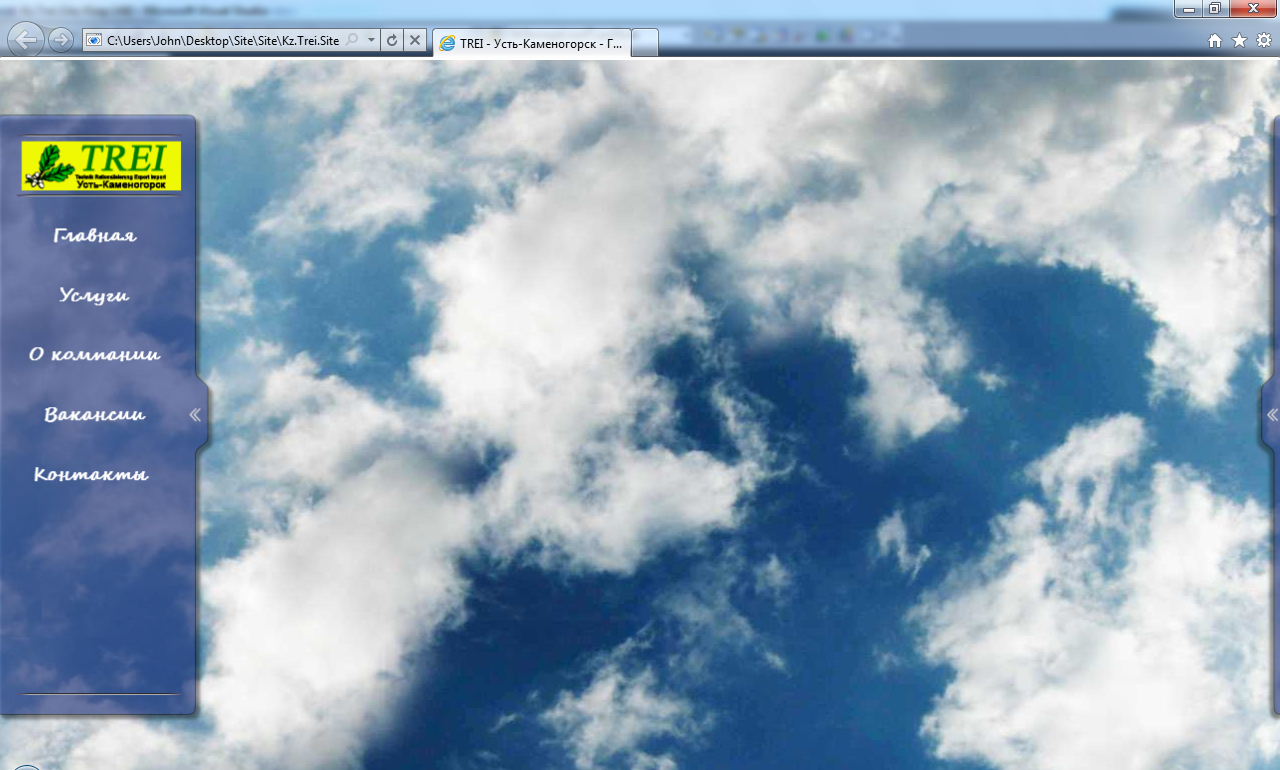
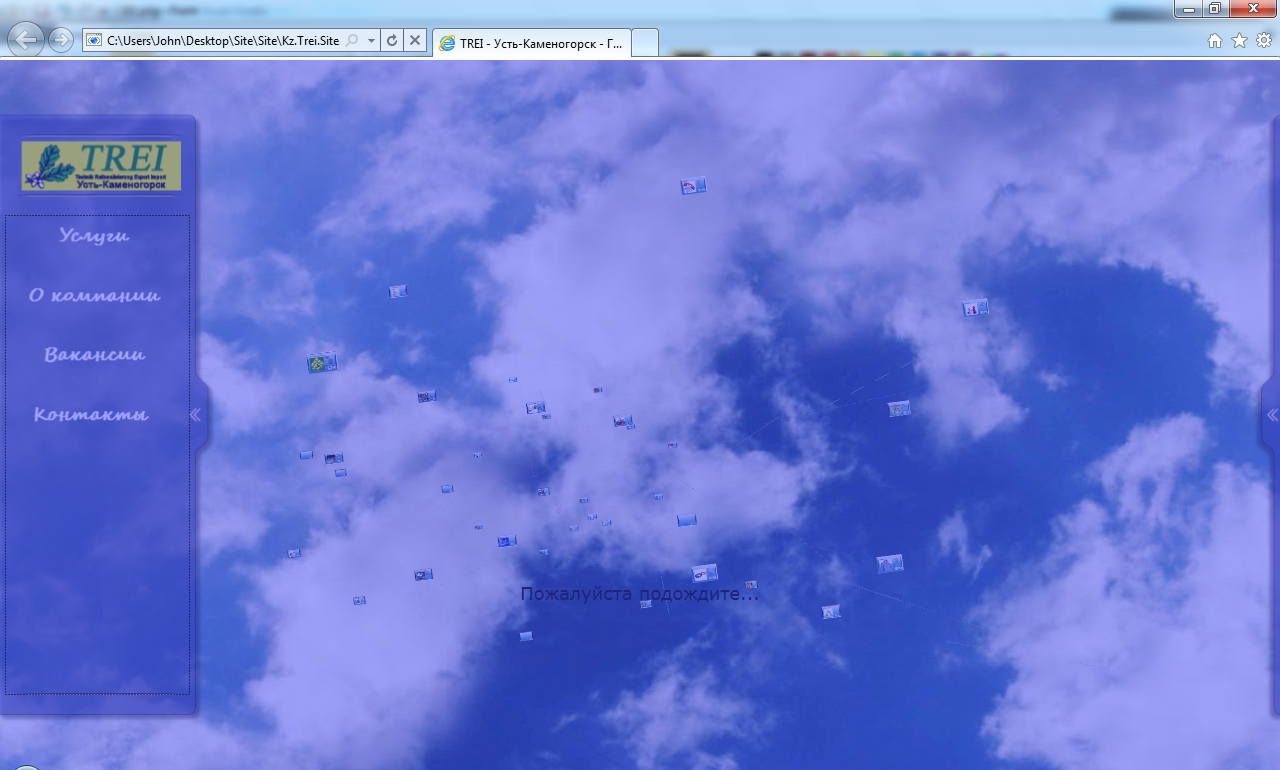
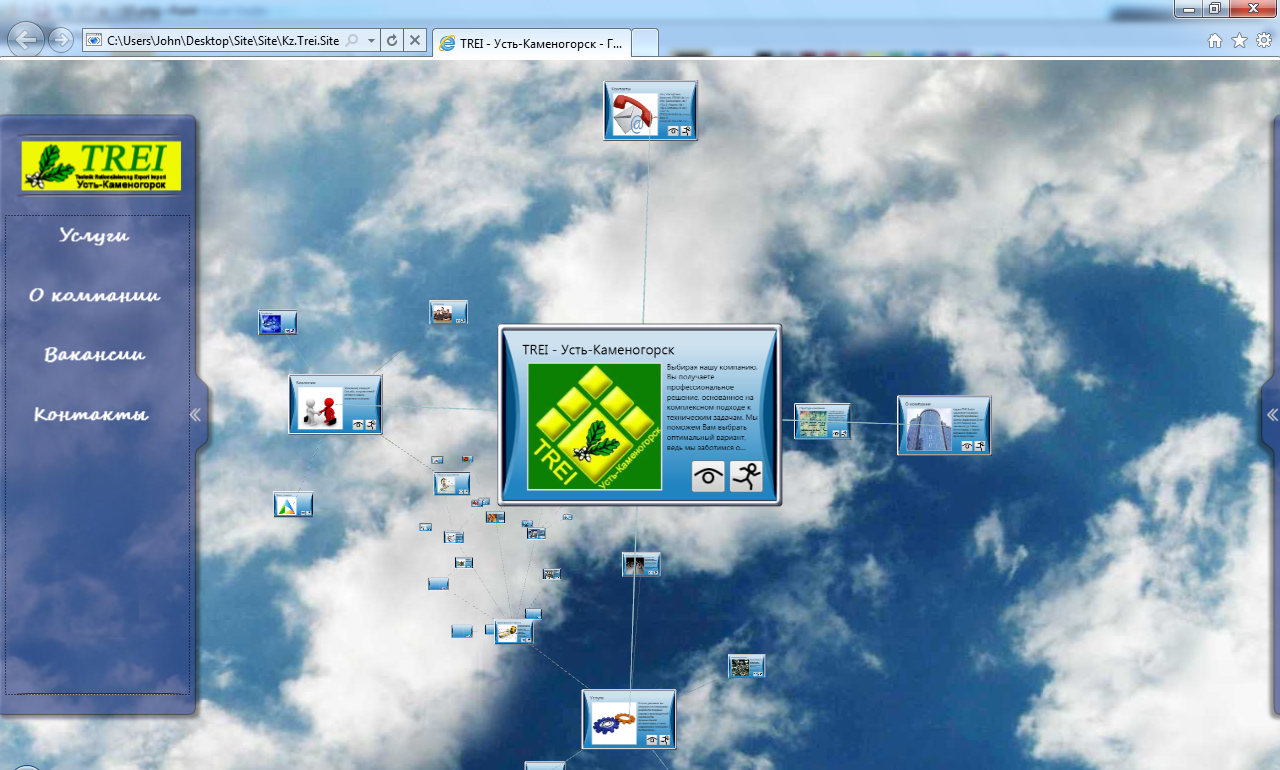
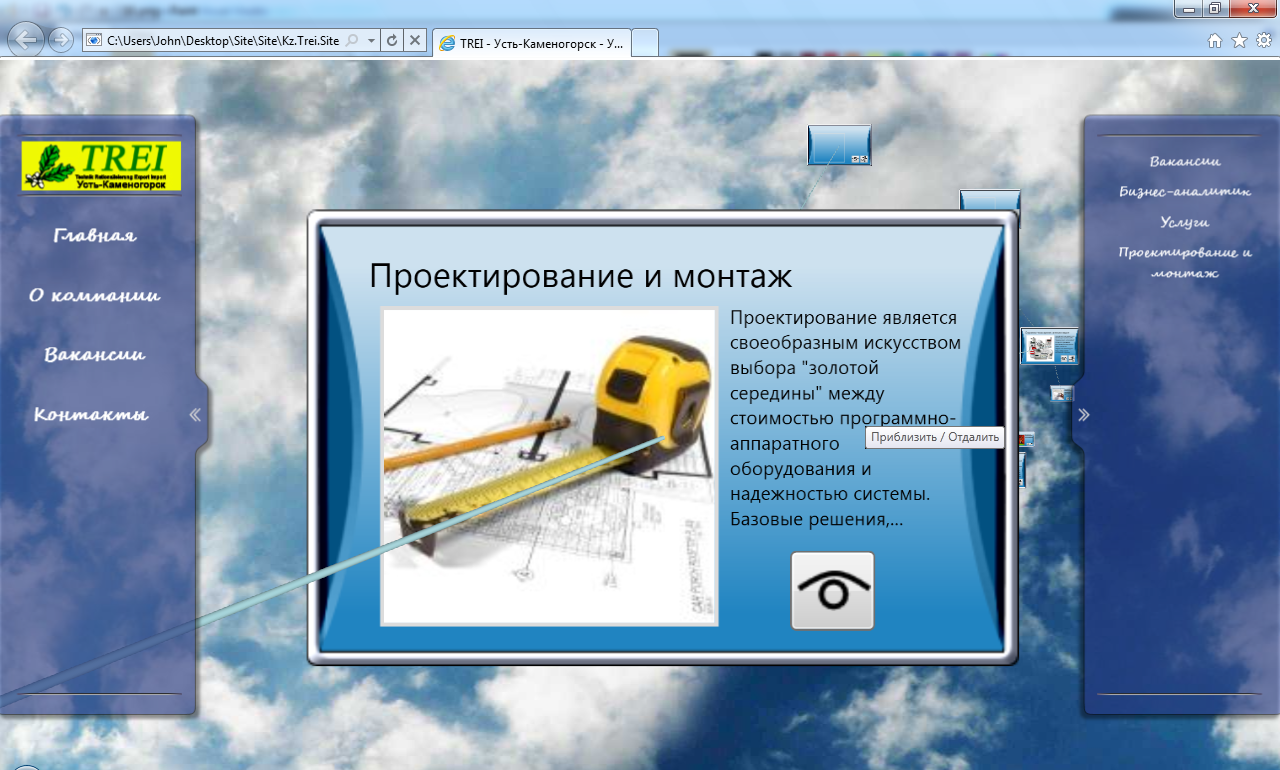
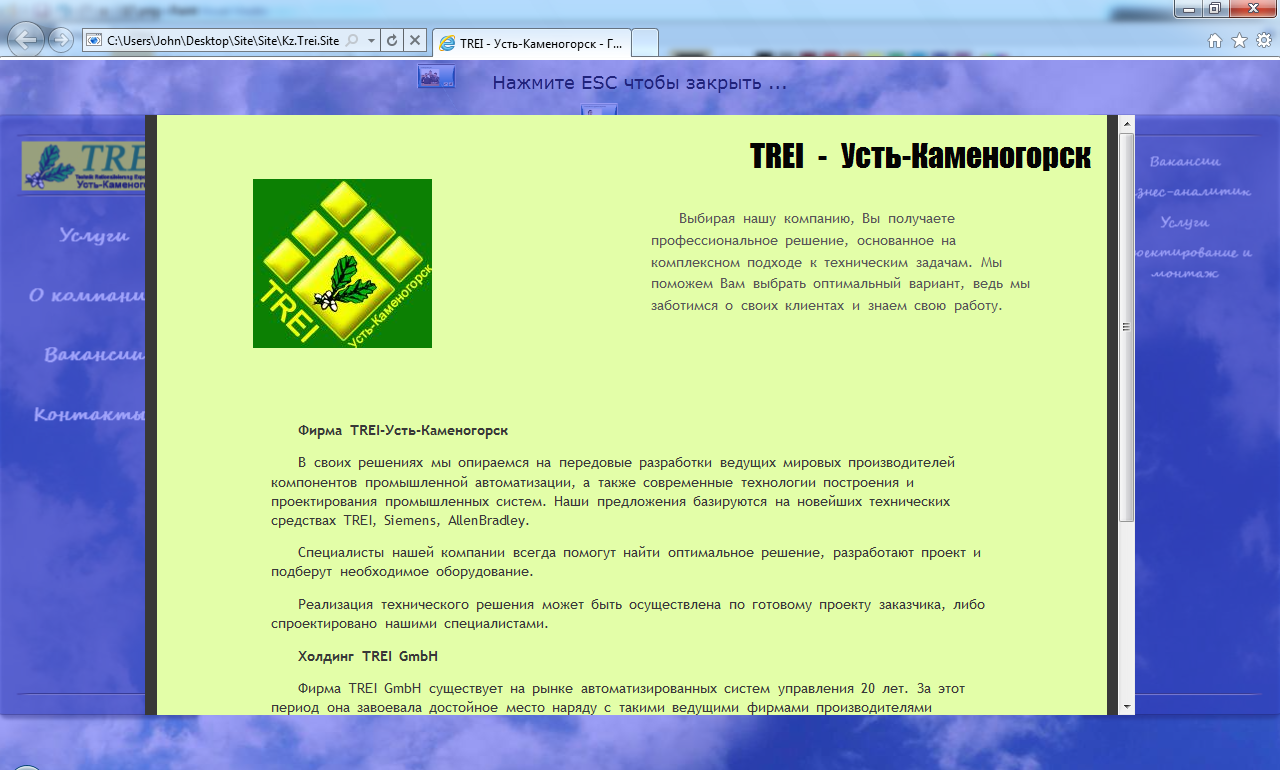
3D website
3D website was built using WPF 3D technology. Features: random widgets arrangement
in motion, bookmarks, sound, dynamic background.
2) 3D website. Picture 1.
2) 3D website. Picture 2.
2) 3D website. Picture 3.
2) 3D website. Picture 4.
2) 3D website. Picture 5.
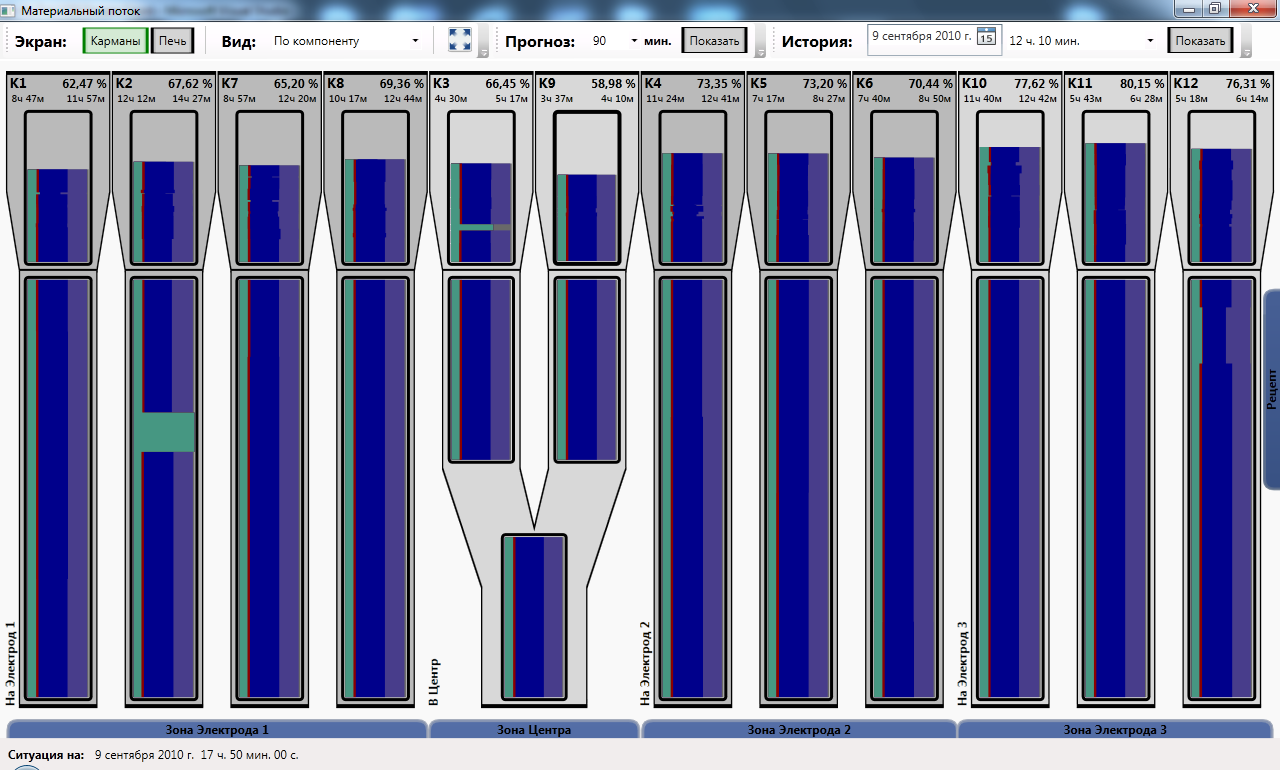
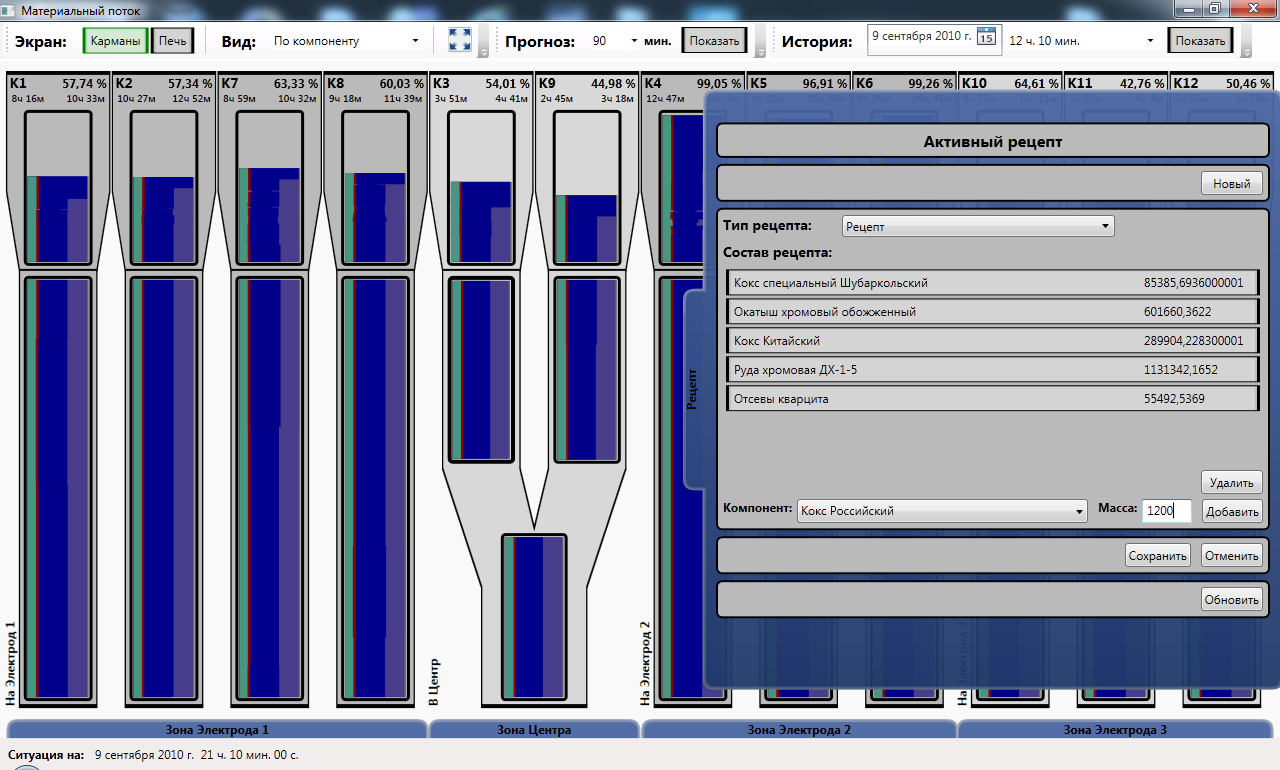
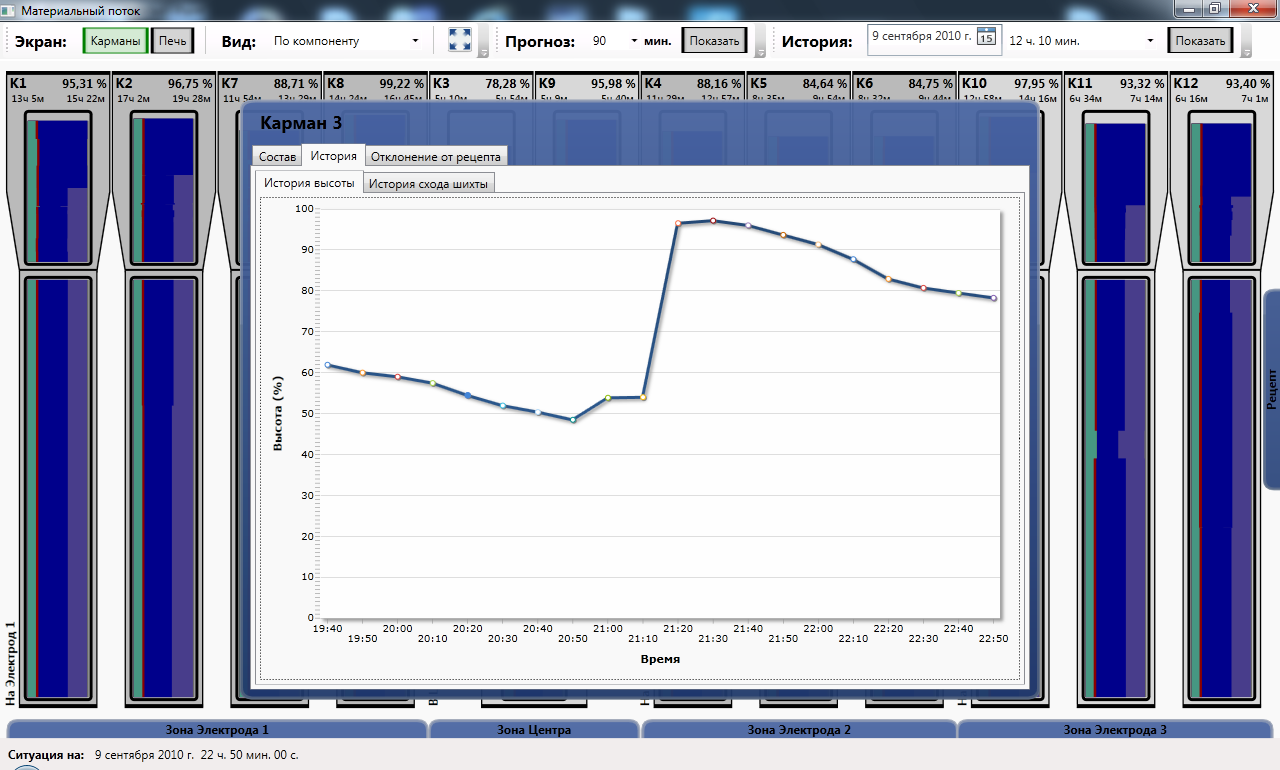
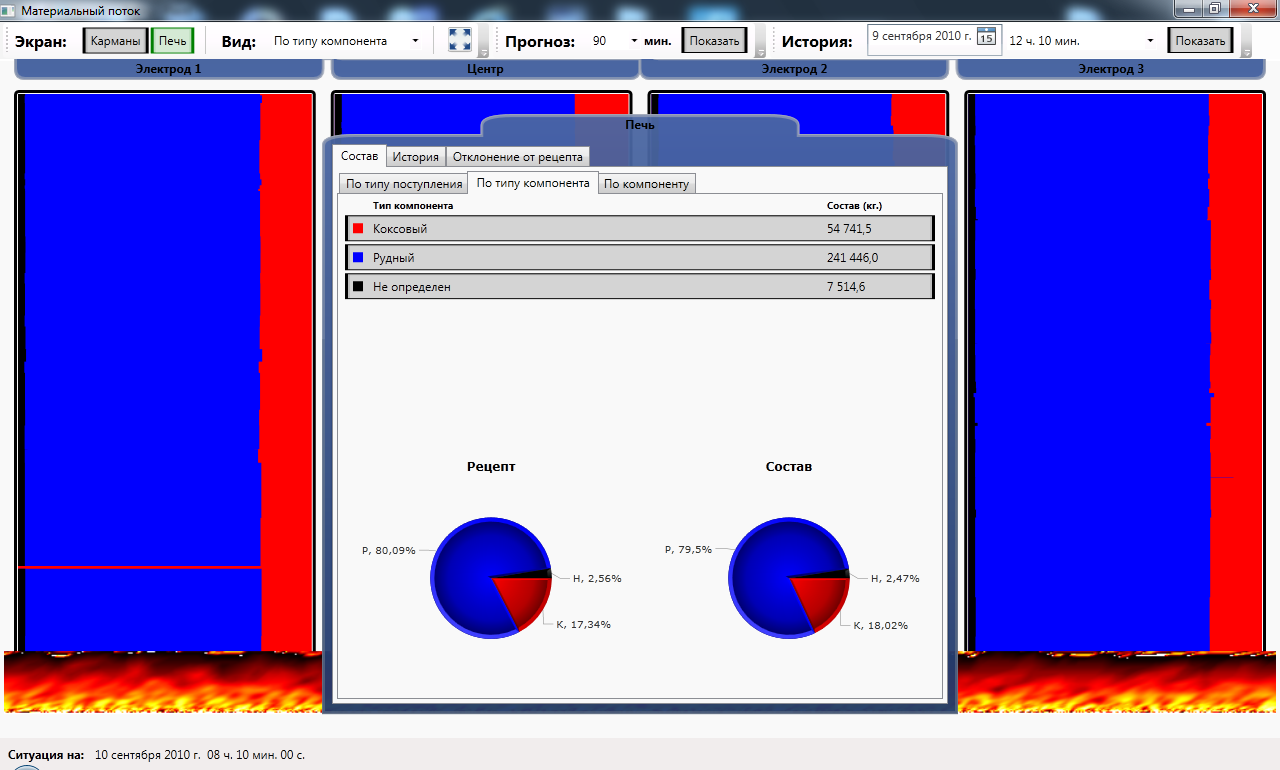
Realtime charge monitoring system
Realtime charge monitoring system. It was implemented as a managed Windows service.
Features: WCF based communication between client and server, very simple and loosely
coupled visualization using data binding (there was only one object and others was
calculated using converters), flexible server side customization (storages structure
and their properties was stored in the database). There were three main screens:
current state, history and forecast. And also there were three main view modes:
by input type, component type and by component.
3) Realtime charge monitoring system. Picture 1.
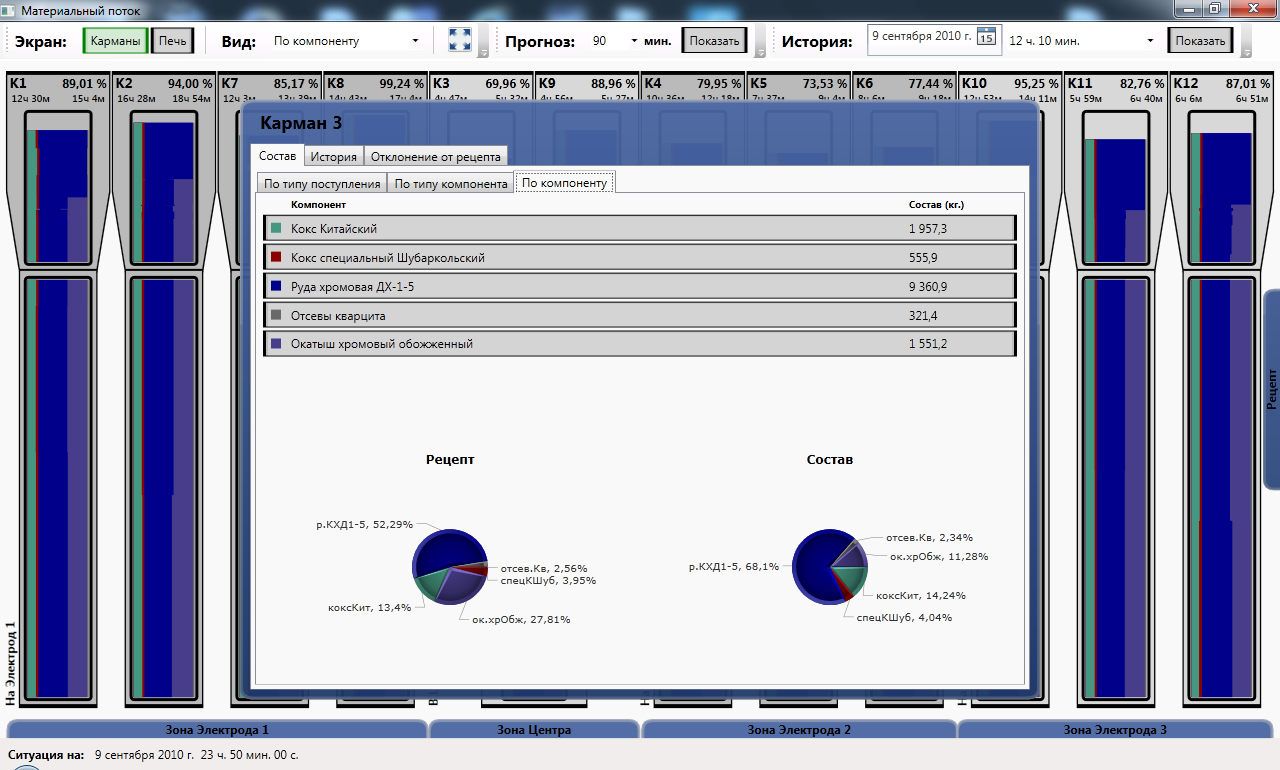
3) Realtime charge monitoring system. Picture 2.
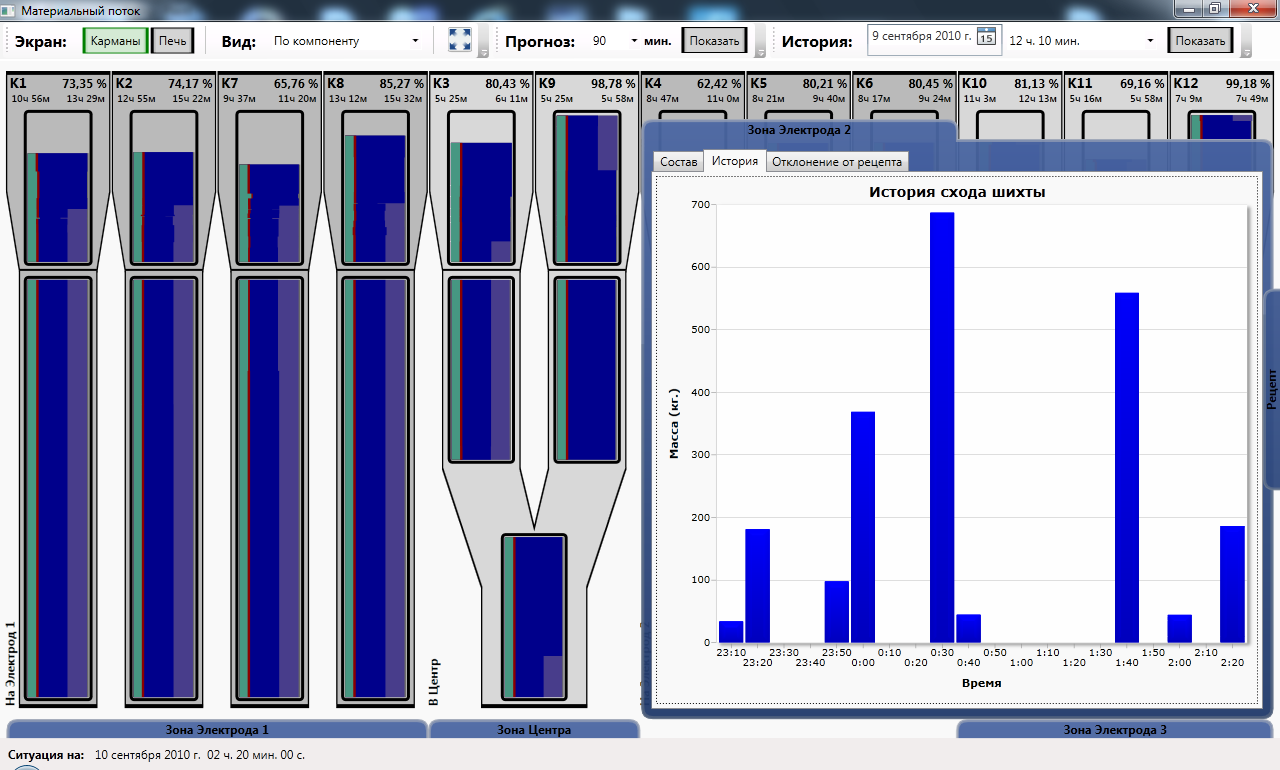
3) Realtime charge monitoring system. Picture 3.
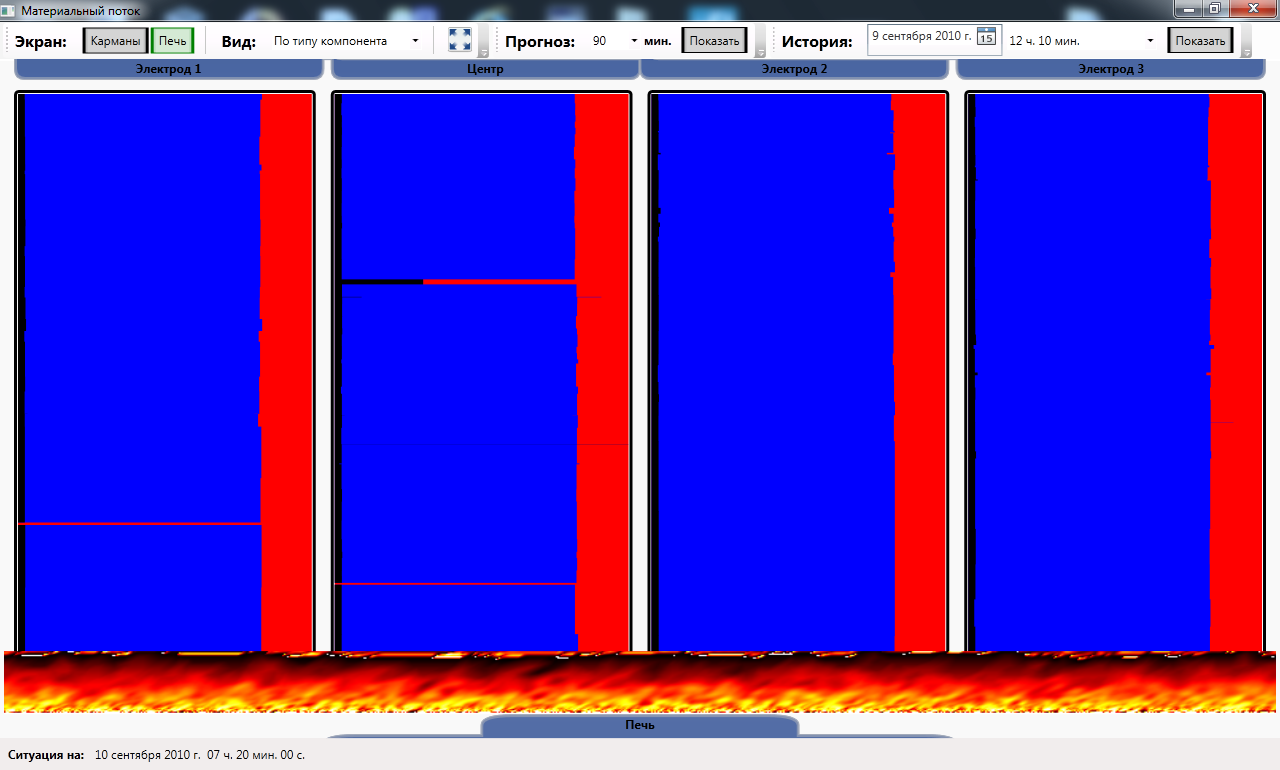
3) Realtime charge monitoring system. Picture 4.
3) Realtime charge monitoring system. Picture 5.
3) Realtime charge monitoring system. Picture 6.
3) Realtime charge monitoring system. Picture 7.
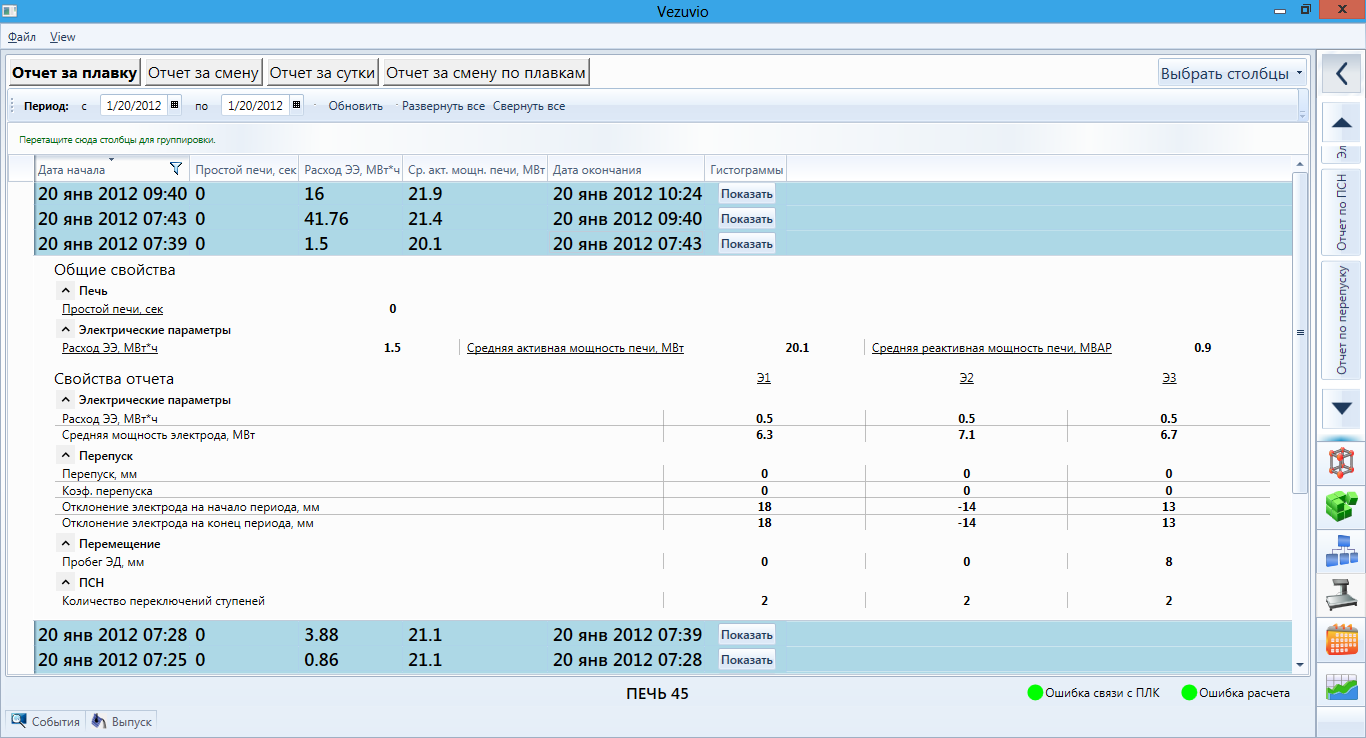
Smelting report
Dynamic smelting report. Report properties was getting from the database.
4) Smelting report. Picture 1.
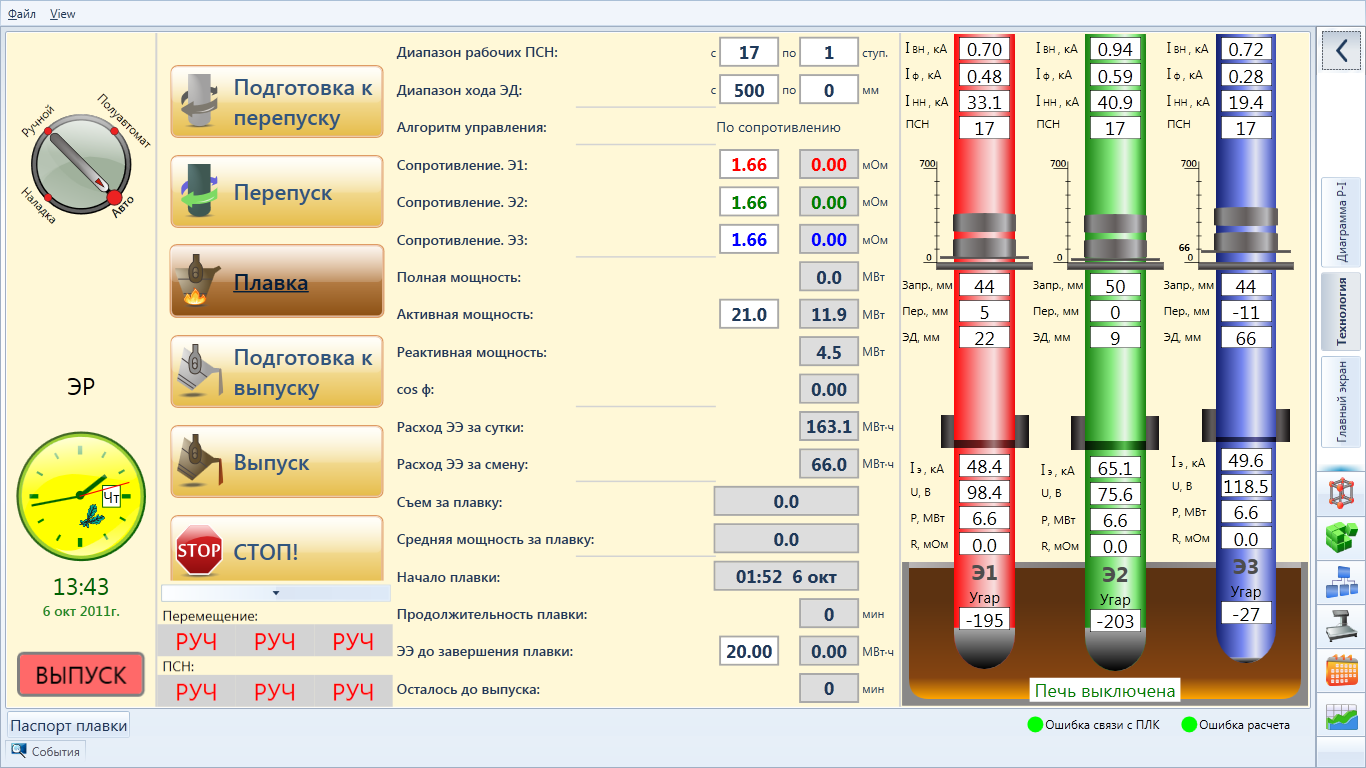
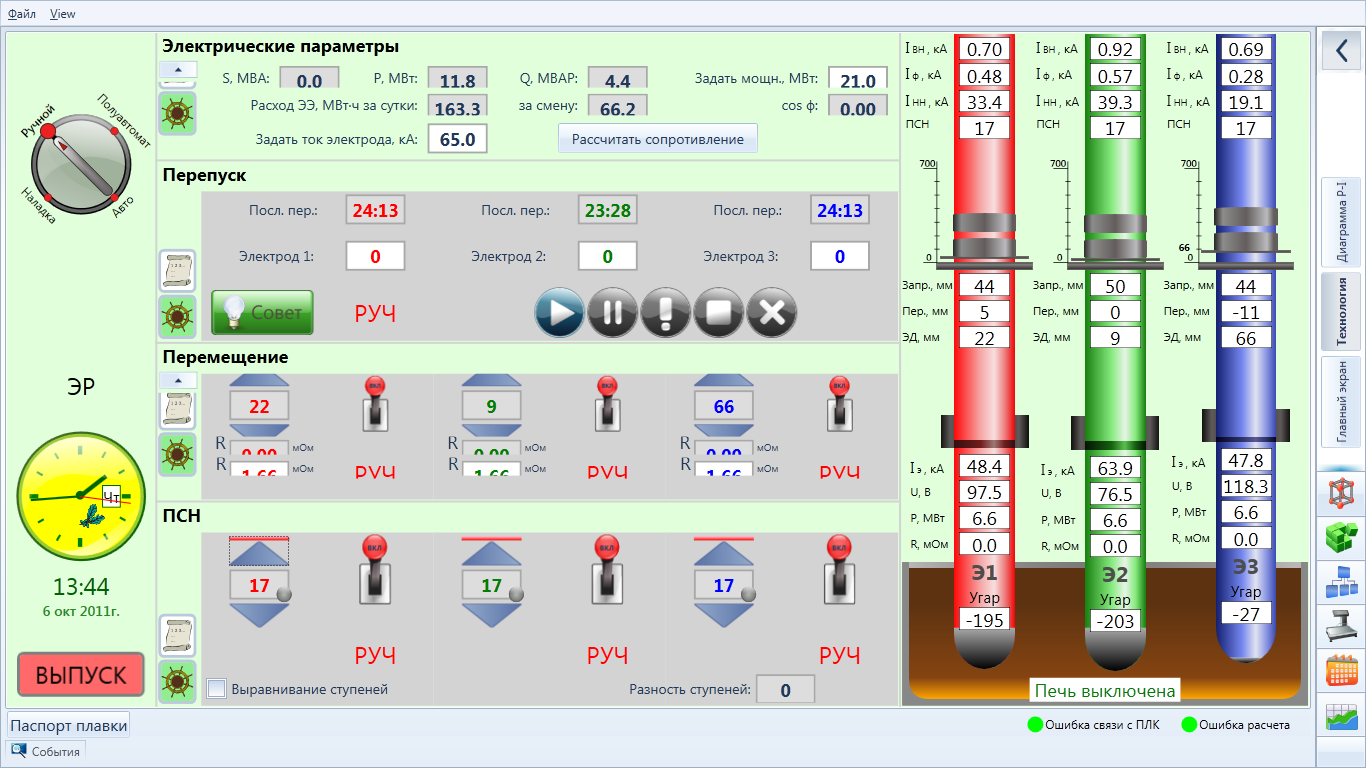
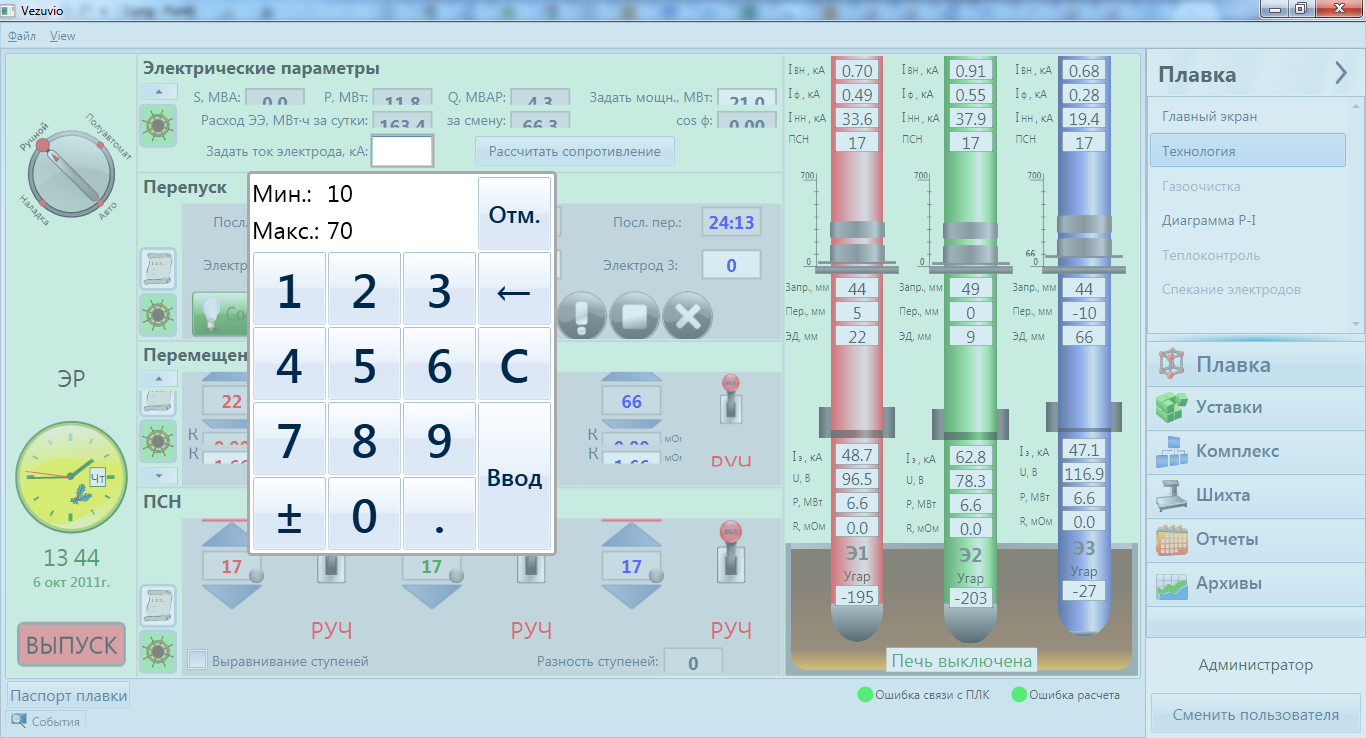
Main technology screen
Most UI elements was implemented as custom controls. There was also a virtual keyboard.